If you’re one of those who think Dynamo is not for you then maybe you should look again at what it could do for you.
Dynamo is a ‘graphical programming’ tool, so yes, it can get complicated, but it is logical. Graphical programming means the complex code that we normally associate with programming is wrapped up into pre-defined nodes, each node contains a snippet of code to perform specific tasks. We, as the programmer, assemble the relevant nodes from the library onto a workspace and connect them together, to create a graph. This graph can then be run in order to carry out the programme.
As Dynamo is a programming tool, it can be configured to carry out almost any task we want; including automating a lot of the mundane, repetitive time-consuming tasks that everybody dislikes doing. It can access things that are difficult to get to in Revit itself, and carry out tasks that are near impossible to do in Revit directly. It can also interface with other programmes such as AutoCAD, Excel, Rhinoceros and Navisworks, meaning data can be imported and exported to and from many places and used in various ways in Revit.
All this means that Dynamo is a very powerful tool in the creation of collaborative BIM projects and shouldn’t be ignored.
Simple Tasks in Dynamo
Ever wanted to array some objects along a path? It’s pretty much impossible – unless you use Dynamo. We must remember that the Rules of Revit still apply in Dynamo. Hosted families such as doors, windows, curtain panels etc. can’t be placed outside their hosts just because we’re using Dynamo, so we still need to think about how to work with Revit. But, it’s not difficult to select edges or lines through Dynamo and then place families at intervals along that edge and build in options for spacing, quantity and offset from the edge.
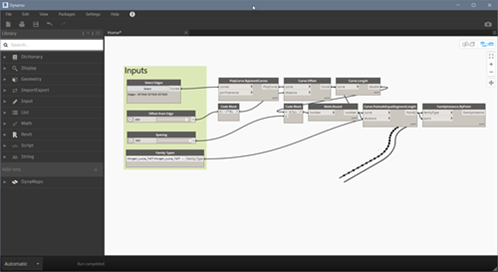
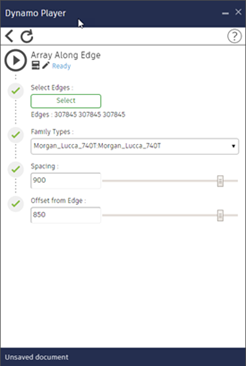
Dynamo Graph to Array Along an Edge with Dynamo Player interface for the same Graph
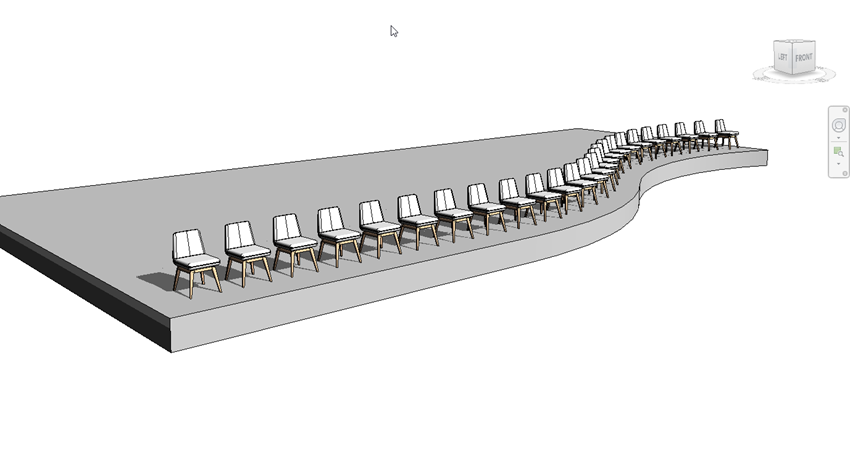
Result of Array Along Edge Graph
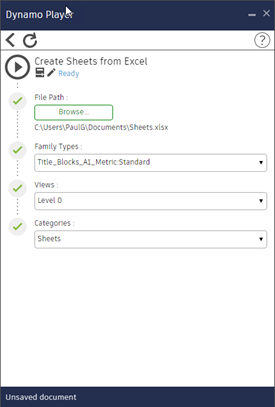
Creating Sheets from a list in an Excel file is a very simple graph to create, can save a lot of time and ensure projects standards are met. Once created, this graph can be reused on every project with very little input other than selecting the project specific Excel file for the relevant list of sheets required.
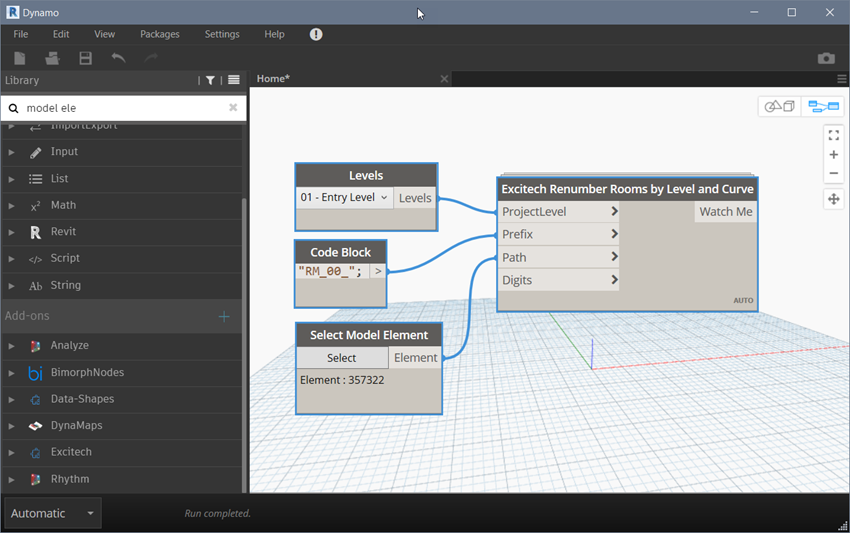
 During modelling doors, windows and rooms are assigned sequential numbers in the order they are placed. This is never the required order for schedules or even in the right format to meet standards. Most other objects have the ‘Mark’ parameter that is left blank during creation so will need numbering once placed. Usually there are conventions to numbering objects, such as the level or room number being used as a prefix followed by a sequential number or letter to make it unique. Rooms are normally identified in a specific sequence, such as starting at the entrance or lift lobby and following around the plan clockwise.
Getting Dynamo to read the number of the room an object is located in and combine it with a sequential number or letter is relatively straightforward. Writing this back to the object is a simple task too. Automating it across an entire project will save hours of someone’s time and relieve them of the depressingly tedious task of numbering them all manually. Nodes can be downloaded to create QR codes or Barcodes for relevant FM Data too.
Creating a graph that allows the user to draw a spline through the rooms in the order required for numbering is a little more complicated, but examples exist to download – we’ll even send you the Symetri version if you request it.
The time saved by automating these tasks can be immense, not just in the cost associated to that time but also the mental wellbeing of the people tasked with the renumbering!
Model Checking
Have you had models where there are an extraordinary number of filters? So many that users just make new ones, because finding if one already exists for their purpose takes too long, hence making the problem even worse. But finding if and where those filters are being applied is impossible in Revit and they can’t be purged either! Dynamo can find if they’re in use and where. Could even delete the ones not in use too!
There some model checking tools available as plug-ins. Some are free too, such as the BIM Interoperability Tools add in. This one ships with some example checks that can be configured to meet your own requirements. But we can do this in Dynamo too. Checking family names meet a prescribed format or have our company identifier at the start of their name. Checking if specific parameters exist and are filled in, plus it can all be exported to Excel too for reporting purposes.
Dynamo is an Open Source tool that allows Packages of custom nodes to be published for everyone to use. The Dynamo community is very knowledgeable, and many have taken the time to create very useful packages. This means that if you’re creating a graph to perform a specific task, it’s likely that someone has tried something creating it for a similar task. Chances are there’s even some custom nodes available in the packages to simplify your own graph creation.
Extending Capability
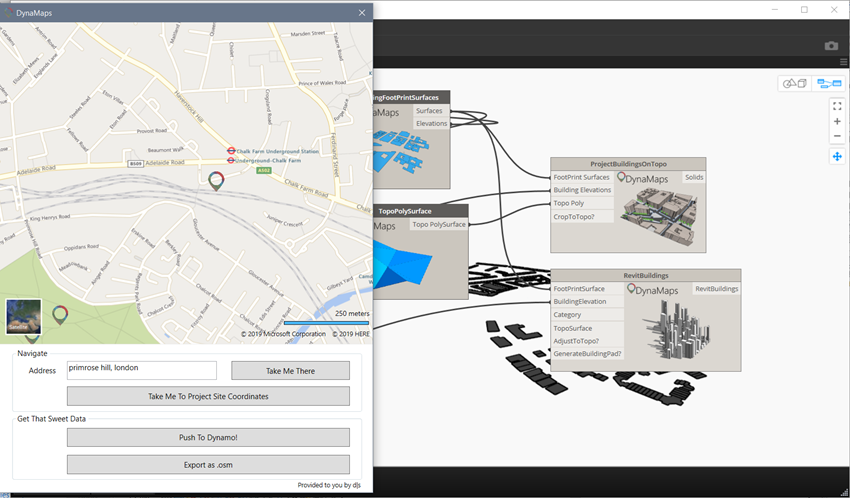
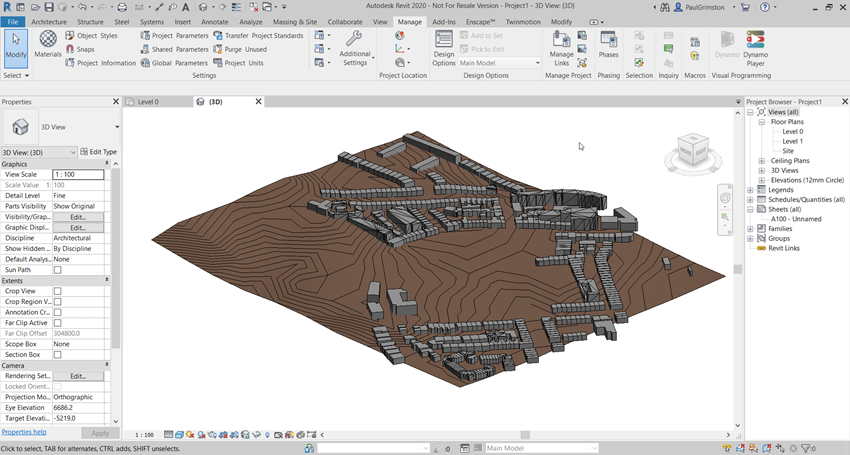
One relatively new package is the DynaMaps package. This allows us to search a map for our site location and import Open Street Map data into Dynamo. From here we can get building outlines or surfaces ready to be extruded, road centrelines that we can create surfaces from, topography points to create a toposurface plus some extra nodes to project the building onto the toposurface. This is a very quick way to get surrounding context into Revit for early stage design.
Getting Started with Dynamo
Dynamo is a very powerful tool. It does take some learning and understanding of the logic behind the graphs. Although once a graph is created, it can be re-used on any Revit project that needs it, so investing time to create a useable graph to automate a tedious task can reap benefits on many projects and save countless hours in the long run. Some can even be utilised by others not familiar with Dynamo through the Dynamo Player which allows users to select inputs and run the script without opening Dynamo itself.
The first step is to define the tasks that need automating and the steps required to carry out those tasks. Once we know what steps we’re trying to get Dynamo to take it becomes a lot easier to define the graph. The best way to get a head start on creating Dynamo graphs is to get some training, Symetri’s Dynamo Essentials training course is a great introduction to learning Dynamo and getting you on your way to creating some really useful Graphs.
If you would like to learn more about Dynamo or the products mentioned in this article, please call 0345 370 1444 or email info@symetri.co.uk.

Author
Paul Grimston
Spending his formative years as an Architectural Technician, followed by a stint in the Exhibition and Graphics industry, Paul has worked for many years on design projects across the UK where he gained diverse experience in the use of design technology in all areas of design. A benefit of Paul’s graphics experience is knowledge of visualisation and presentation techniques that take advantage of the latest 3D modelling software.


